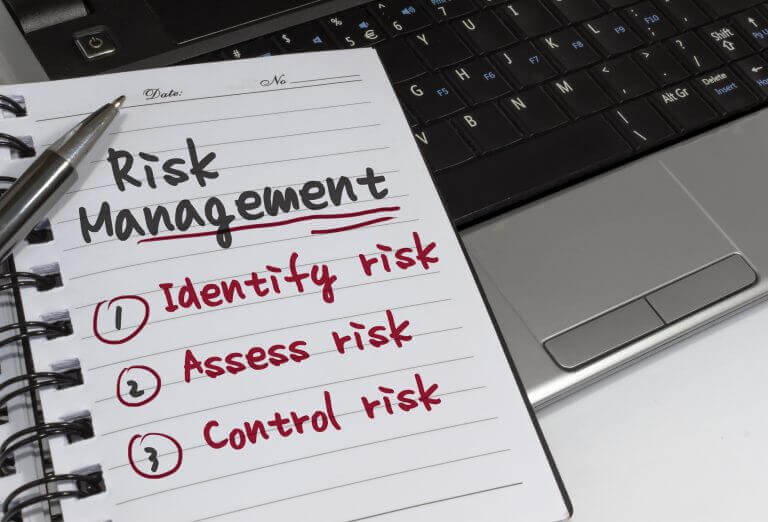
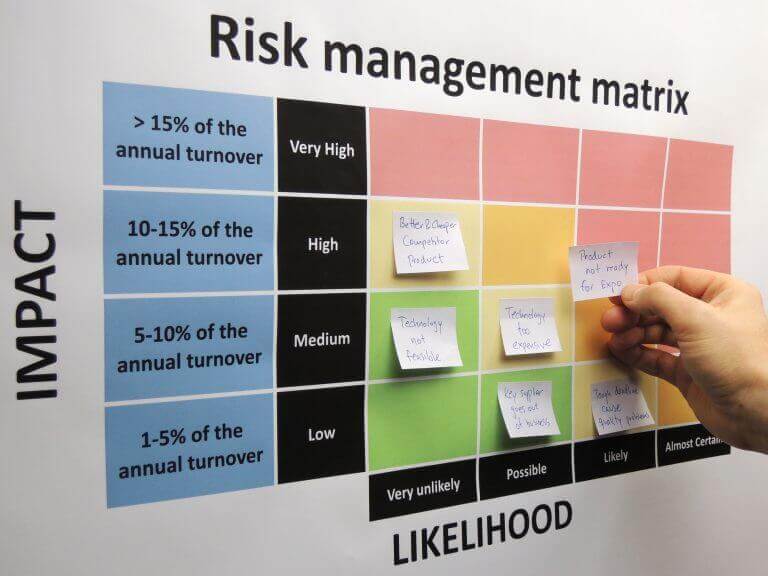
If you are in a business that requires you to manage risks, then creating a risk assessment matrix in Excel can help you to identify, assess, and rank the risks your business is facing. A risk assessment matrix is a visual tool that helps you to evaluate the probability and impact of risks that your business may face. It is a useful way of prioritising risks and deciding which risks to address first.
Understanding Risk Assessment is the first step in creating a risk assessment matrix in Excel. Risk Assessment is the process of identifying, assessing, and prioritising risks to minimise the adverse effects of uncertain events on your business.
It is a systematic process that involves identifying potential risks, assessing their likelihood and impact, and determining how to manage them. By understanding the risks that your business is facing, you can take steps to mitigate or eliminate them.
Setting Up Your Risk Assessment Matrix in Excel is the next step. Excel is a powerful tool for creating a risk assessment matrix. It is a flexible tool that allows you to customise your risk assessment matrix to suit your business needs.
You can use Excel to create a simple matrix or a more complex one that includes multiple risk factors. With Excel, you can easily update your risk assessment matrix as your business changes, making it a valuable tool for ongoing risk management.
Key Takeaways
- Risk assessment matrices are visual tools that help you to evaluate the probability and impact of risks that your business may face.
- Understanding the risks that your business is facing is the first step in creating a risk assessment matrix in Excel.
- Excel is a powerful tool for creating a risk assessment matrix that can be customised to suit your business needs.
Understanding Risk Assessment
When it comes to project management, risk assessment is a crucial element of the process. It involves identifying potential risks, analyzing their likelihood and impact, and taking steps to mitigate them. Creating a risk assessment matrix in Excel is an effective way to organize and visualize this information. In this section, we will explore the basics of risk assessment and why it is important in project management.
Defining Risk and Its Components
Risk can be defined as the possibility of an event occurring that will have an impact on the achievement of objectives. It is made up of two components: likelihood and consequence. Likelihood refers to the probability of an event occurring, while consequence refers to the impact that event will have if it does occur.
When assessing risk, it is important to consider both the likelihood and consequence of an event. This can be done by assigning a probability and impact rating to each risk. Probability refers to the chance that a risk will occur, while impact refers to the severity of the consequences if it does occur.
The Importance of Risk Assessment in Project Management
Risk assessment is an essential part of project management as it helps to identify potential risks and take steps to mitigate them. By conducting a risk assessment, you can identify risks that may affect the project’s timeline, budget, or quality. It also helps to identify stakeholders who may be impacted by the risks and involve them in the risk management process.
Creating a risk assessment matrix in Excel is an effective way to organize and visualize the risks identified during the assessment. The matrix allows you to assign a probability and impact rating to each risk and calculate an overall risk score. This score can then be used to prioritize risks and determine which risks require immediate attention.
In summary, risk assessment is a critical component of project management. It helps to identify potential risks, analyze their likelihood and impact, and take steps to mitigate them. Creating a risk assessment matrix in Excel is an effective way to organize and visualize this information. By conducting a risk assessment, you can identify risks that may affect the project’s timeline, budget, or quality and involve stakeholders in the risk management process.
Setting Up Your Risk Assessment Matrix in Excel
Creating a risk assessment matrix in Excel can be a useful tool for evaluating risks and making informed decisions. Here are some steps to help you set up your risk assessment matrix in Excel.
Preparing the Excel Environment
Before setting up your risk assessment matrix in Excel, you need to make sure that your Excel environment is set up correctly. This means that you need to have a grid or table in place where you can input your data. You can create a table by selecting the cells where you want the table to be and then clicking on the “Insert” tab and choosing “Table” from the drop-down menu.
Determining Risk Categories and Rating Scale
The next step is to determine the risk categories and rating scale that you will use in your risk assessment matrix. This involves identifying the different categories of risks that are relevant to your situation and assigning severity ratings to each category. You can use a legend to help you identify the different categories and severity ratings.
For example, you might use a rating scale of 1 to 5, with 1 representing a low severity rating and 5 representing a high severity rating. You can also use conditional formatting to highlight the severity of each risk in your risk assessment matrix.
It is also important to consider the likelihood of an event occurring when assigning severity ratings. You can use a rating scale to assign likelihood ratings to each risk. For example, you might use a rating scale of 1 to 5, with 1 representing a low likelihood rating and 5 representing a high likelihood rating.
By following these steps, you can create a risk assessment matrix in Excel that is a useful tool for evaluating risks and making informed decisions.
Populating the Risk Matrix
When creating a risk assessment matrix in Excel, the first step is to input the risks and assign numerical values to them. The values should correspond to the risk levels, which are typically based on the likelihood and severity of the risk.
Inputting Risks and Assigning Values
To input risks, you can create a table in Excel with columns for the risk description, likelihood, severity, and numerical value. The likelihood and severity can be assigned values from 1 to 5, with 5 being the highest. The numerical value can be calculated by multiplying the likelihood and severity values.
For example, if the likelihood of a risk occurring is 3 and the severity is 4, the numerical value would be 12 (3 x 4). You can use conditional formatting to highlight the risks with the highest numerical values.
Applying Formulas and Functions for Automation
To automate the process of calculating the numerical value, you can use formulas and functions in Excel. The INDEX and MATCH functions can be used to assign numerical values based on the likelihood and severity values.
For example, you can create a table with the likelihood values in column A and the severity values in row 1. You can then use the INDEX and MATCH functions to look up the corresponding numerical value based on the likelihood and severity values.
The formula would be as follows: =INDEX(Table,MATCH(Likelihood,Column A,0),MATCH(Severity,Row 1,0))
Where “Table” is the range of cells that contains the numerical values, “Likelihood” is the cell that contains the likelihood value, and “Severity” is the cell that contains the severity value.
By using these formulas and functions, you can quickly and easily populate the risk assessment matrix in Excel. This can save you time and ensure that your risk assessment is accurate and reliable.
In conclusion, populating the risk matrix in Excel requires inputting risks and assigning values, as well as applying formulas and functions for automation. By following these steps, you can create a comprehensive risk assessment matrix that accurately reflects the risks associated with a particular task, event, or hazard.
Analysing and Interpreting the Risk Matrix
When you have completed your risk assessment matrix in Excel, it is time to analyze and interpret the results. This will help you to prioritize risks and make informed decisions. In this section, we will discuss how to interpret the risk matrix and use it to make decisions.
Prioritising Risks and Decision-Making
One of the main benefits of using a risk assessment matrix is that it helps you to prioritize risks. You can do this by assigning a priority level to each risk based on its likelihood and consequences. You can then use this information to make informed decisions about how to manage each risk.
To prioritize risks, you need to look at the risk level of each risk. The risk level is determined by the intersection of the likelihood and consequences of the risk. The higher the risk level, the higher the priority. You can use color coding to make it easier to see which risks are high priority and which are low priority.
When making decisions about how to manage each risk, you need to consider the benefits and threats of each option. You should also consider the potential consequences of each option. You can use the risk assessment matrix to help you make informed decisions by comparing the risk level of each option.
Visual Representation of Risks
Visual representation of risks is an effective way to convey information to stakeholders. You can use charts to show the risk level of each risk. Scatter charts are particularly useful for this purpose. You can use axis scales to show the likelihood and consequences of each risk. You can also use data labels to show the priority level of each risk.
Color coding is another effective way to visually represent risks. You can use different colors to represent different priority levels. This makes it easy to see which risks are high priority and which are low priority.
In conclusion, analyzing and interpreting the risk matrix is an important part of the risk assessment process. It helps you to prioritize risks and make informed decisions. Visual representation of risks is an effective way to convey information to stakeholders. You can use charts, color coding, and data labels to make it easier to see which risks are high priority and which are low priority.
Enhancing the Risk Matrix
When it comes to creating a risk assessment matrix in Excel, there are a few advanced techniques you can use to enhance your matrix. Here are two techniques that can take your risk matrix to the next level:
Advanced Excel Techniques
Excel is a powerful tool for data analysis, and there are many advanced techniques you can use to create a more sophisticated risk matrix. One technique is to use pivot tables to summarise and analyse your data. Pivot tables allow you to quickly summarise large amounts of data and identify trends and patterns.
Another technique is to use formulas to calculate your risk scores automatically. You can use formulas to calculate the likelihood and impact of each risk, and then use conditional formatting to colour-code the cells in your risk matrix based on the risk scores. This makes it easy to identify high-risk items at a glance.
Incorporating Feedback and Updates
Creating a risk assessment matrix is an ongoing process, and it’s important to incorporate feedback and updates into your matrix. One way to do this is to create a risk register that tracks all of the risks in your organisation. This register should include information about each risk, such as the likelihood and impact, the mitigation efforts that have been taken, and the risk response plan.
As new risks are identified or existing risks change, you can update your risk register and use it to update your risk matrix. This ensures that your matrix always reflects the current state of your organisation’s risks.
Another way to incorporate feedback and updates is to link your risk matrix to your organisation’s strategic plan. This allows you to align your risk management efforts with your organisation’s goals and objectives, and ensures that your risk matrix is always relevant and up-to-date.
By using these advanced techniques and incorporating feedback and updates, you can create a risk assessment matrix in Excel that is both comprehensive and effective.
Implementing Risk Management Actions
Once you have identified and assessed the project risks using a risk assessment matrix in Excel, it’s time to develop a risk response plan. This plan will outline how you will address each identified risk and what actions you will take to mitigate those risks.
Developing a Risk Response Plan
The risk response plan should be developed with input from all team members and stakeholders. It should address each identified risk and outline the actions that will be taken to mitigate those risks. The plan should also include a timeline for when each action will be taken and who will be responsible for implementing it.
To develop a risk response plan, follow these steps:
- Identify the risks that require a response. These are the risks that have been assessed as high or medium priority.
- Determine the appropriate risk response for each identified risk. The response can be to avoid, transfer, mitigate, or accept the risk.
- Develop a plan for each identified risk that outlines the actions that will be taken to address the risk. This plan should include a timeline for when each action will be taken and who will be responsible for implementing it.
- Review the risk response plan with all team members and stakeholders to ensure that everyone is aware of the plan and their responsibilities.
Communication and Reporting to Stakeholders
Communication and reporting to stakeholders is an essential part of the risk management process. It is important to keep stakeholders informed of the project risks, compliance requirements, and risk response actions.
To communicate effectively with stakeholders, follow these steps:
- Develop a communication plan that outlines how you will communicate with stakeholders throughout the project. This plan should include the frequency of communication, the format of communication, and the stakeholders who will be communicated with.
- Report project risks and compliance requirements to stakeholders on a regular basis. This will ensure that everyone is aware of the risks and the actions being taken to mitigate them.
- Report on the progress of risk response actions to stakeholders. This will keep them informed of the progress being made and any changes to the risk response plan.
- Ensure that all stakeholders have access to the risk assessment matrix in Excel and the risk response plan. This will enable them to review the risks and the actions being taken to address them.
By implementing these risk management actions, you can ensure that project risks are addressed and mitigated effectively. Effective communication and reporting to stakeholders will also ensure that everyone is aware of the risks and the actions being taken to mitigate them.
Conclusion
Creating a risk assessment matrix in Excel can be a valuable tool for project management and productivity in organisations. By evaluating the likelihood and impact of potential risks, you can develop a plan to mitigate or avoid them altogether.
When creating your risk assessment matrix, it is important to consider the specific needs of your organisation and project. This includes identifying relevant risks, determining the likelihood and impact of those risks, and assigning a risk score.
Using Excel, you can create a matrix that categorises risks based on their likelihood and impact, making it easier to prioritise and address them. By using conditional formatting, you can also visually highlight high risk areas, making it easier to identify potential issues.
It is important to regularly review and update your risk assessment matrix to ensure that it remains relevant and accurate. This will help you to stay on top of potential risks and ensure that you are taking appropriate steps to manage them.
Overall, creating a risk assessment matrix in Excel can be a valuable tool for project management and productivity in organisations. By taking the time to identify and evaluate potential risks, you can develop a plan to mitigate or avoid them, helping to ensure the success of your project.
Frequently Asked Questions
What are the steps to construct a risk assessment matrix using Excel?
Creating a risk assessment matrix in Excel is a straightforward process. First, you need to identify the risks and their corresponding impact level. Then, you can assign a probability score to each risk. Once you have these scores, you can create a matrix using Excel’s conditional formatting. Finally, you can add labels to the matrix and customise it to suit your needs.
Where can I find a complimentary risk matrix template for Excel?
There are many free risk matrix templates available online that you can download and use. You can search for them on Google or check out websites like ExcelTemplates.net or Smartsheet.com. These templates are pre-designed with the necessary formulas and formatting to create a risk matrix in Excel.
How can I customise a 5×5 risk matrix template in Excel?
Customising a 5×5 risk matrix template in Excel is easy. You can change the axis labels, add or remove rows and columns, and adjust the formatting to suit your needs. To do this, you need to select the cells you want to change and then use Excel’s formatting tools to make the necessary adjustments.
What is the process for conducting a baseline risk assessment with an Excel template?
To conduct a baseline risk assessment using an Excel template, you need to first identify the risks and their corresponding impact level. Then, you can assign a probability score to each risk. Once you have these scores, you can use the template to create a matrix. Finally, you can analyse the matrix to determine the overall risk level and develop a risk management plan.
Can you detail the creation of a 3×3 risk matrix in Excel?
Creating a 3×3 risk matrix in Excel follows the same basic steps as creating a 5×5 matrix. However, you will need to adjust the formatting and formulas to suit the smaller size of the matrix. You can also adjust the axis labels and add or remove rows and columns as needed.
What guidelines should be followed when developing a risk model in Excel?
When developing a risk model in Excel, it is important to follow certain guidelines to ensure accuracy and consistency. These include using consistent data sources, keeping formulas and calculations simple, and testing the model thoroughly before use. It is also important to document the model and update it regularly to reflect changes in the risk environment.